I have reason to wonder why several real estate investment trust (REITs) have forward price-to-earnings ratio (PE) that are HIGHER than their current (aka trailing) PE ratio. This suggests that they are forecasting negative growth in earnings. However, looking at eps forecasts, it doesn’t seem negative.
Key thing to understand about REITs is they must pay a minimum of 90% of taxable income in the form of shareholder dividends each year. So, only 10% of the REIT’s taxable income can be reinvested back into the REIT to buy new properties. Note that income is the earnings (E) in P/E.
In regard to the PE ratio, algebra easily shows if
PE = P/e0 and <PE>= P/<e1>
then
<g> = PE/<PE>
With most equities, we do not expect there to be negative earnings growth. Moreover, if there is negative earnings growth, we expect the PE to be low.
Having a look at MAA, Mid-America Apartment Communities, Inc., a real estate investment trust. It’s PE and fwd <PE> are 28 and 32 , respectively, according to CNBC.com. These are not low PEs. The math then shows that forward earnings are expected to be 0.87 cents for every $1 of previous year’s earnings, or -13% negative growth.
Thought one, is that maybe in the special case of REITs, the cash flow of dividends is on the income statement, which would be atypical. Going to the 2022 10K of MAA, the only dividends taken out of net income are those to Series I preferred shareholders, which amount to less than .2% of revenue. From the financial statements,
| 2022 | 2021 | 2020 | |||||||
| Net income | 633,748 | 530,103 | 251,274 | ||||||
| Dividends paid on common shares | (539,605) | (470,401) | (457,355) | ||||||
| Dividends paid on preferred shares | (3,688) | (3,688) | (3,688) | ||||||
Therefore,
| Pct div/NI | 85% | 89% | 182% |
Did I say the payout must be at least 90%? Close enough?!
Still haven’t explained why negative growth of -13% in earnings is expected. From the income statement,
| Earnings per common share – diluted: | 2022 | 2021 | 2020 | |||
| Net income available for MAA commonshareholders | $ 5.48 | $ 4.61 | $ 2.19 | |||
This trend definitely is not negative.
Is some reduction expected in 2023? Looking at the consensus projections of 6 analysts from cnbc.com I see the reason –
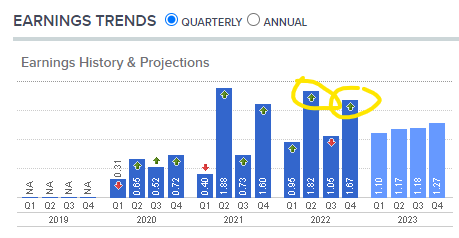
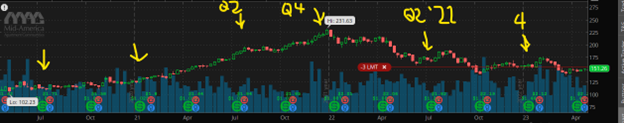
MAA had some crazy beats in Q2 and Q4 2022. As a matter of fact, the surprise beats happened in 2020 and 2021 in the same Q2 and Q4 quarters. What unexpected windfalls happened? Did the stock price surge on these?
For the latter, not that much. So even without finding out what the windfalls were, it sems like these were expected by the market even though the analysts didn’t say so. Eyeballing the forecasts, if I thought the windfalls would repeat, I would adjust the eps forecast to 1.10+1.65+1.18+1.35 = 5.28, which would make forward <PE> = 151/5.28 = 29. Thus eps growth estimates would only be 28/29 -1 = -3%, instead of -14%. This is IF the windfall Q2/Q4 eps surprises continue. The approximate yield is 3.7%.
It may be the case that all REITS received a surprise windfall in Q2 and Q4 of previous years. Something to look into.
-Robert
![]()
![]()
![]()